Photo by Tim Mossholder on Unsplash
In our first blog in this series, we outlined some of the key terms linked to food security. In this blog, we will give an overview of some of the key findings of the FAO report - The State of Food Security and Nutrition in the World 2022 - focusing on food insecurity trends across the world between 2014-2021.
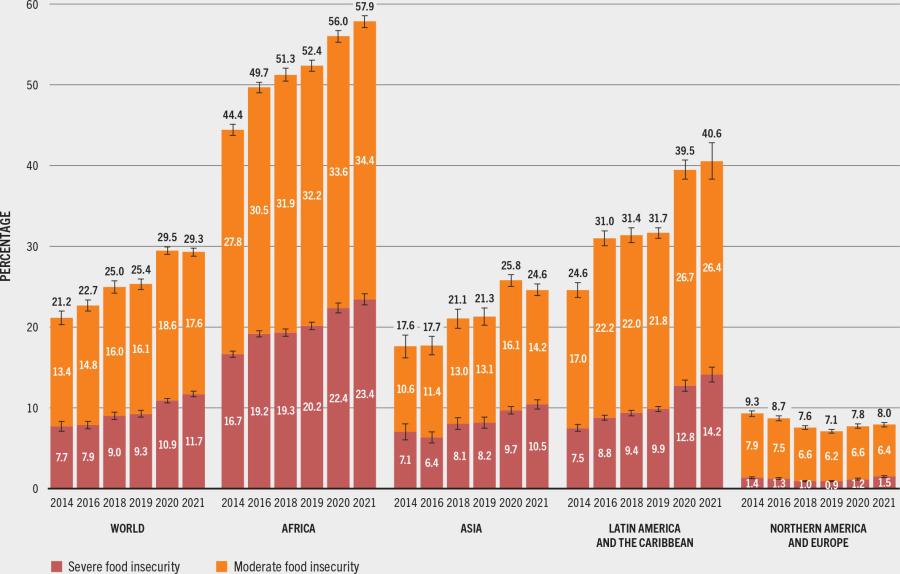
Figure 7 from the report gives a great overview of the percentage of the population worldwide and in different countries that is suffering from moderate or severe insecurity.
Figure 7: MODERATE OR SEVERE FOOD INSECURITY REMAINED STABLE AT THE GLOBAL LEVEL DESPITE INCREASES IN EVERY REGION EXCEPT ASIA, WHEREAS SEVERE FOOD INSECURITY INCREASED GLOBALLY AND IN EVERY REGION
NOTE: Differences in totals are due to rounding of figures to the nearest decimal point.
Image source: FAO.
Some important things to note from this data:
- ~30% of people on Earth are food insecure!!!
- Though food insecurity (both moderate and severe) remained stable worldwide between 2020-2021, it has increased by nearly 10% from 2014-2021
- The increase in food insecurity over this time period has not been equal across the world:
- Africa saw a 13.5% increase;
- Asia saw a 7% increase (though it should be noted that there was a 1.2% decrease between 2020-2021);
- Latin America saw a 16% increase;
- North America and Europe saw a 1.3% decrease.
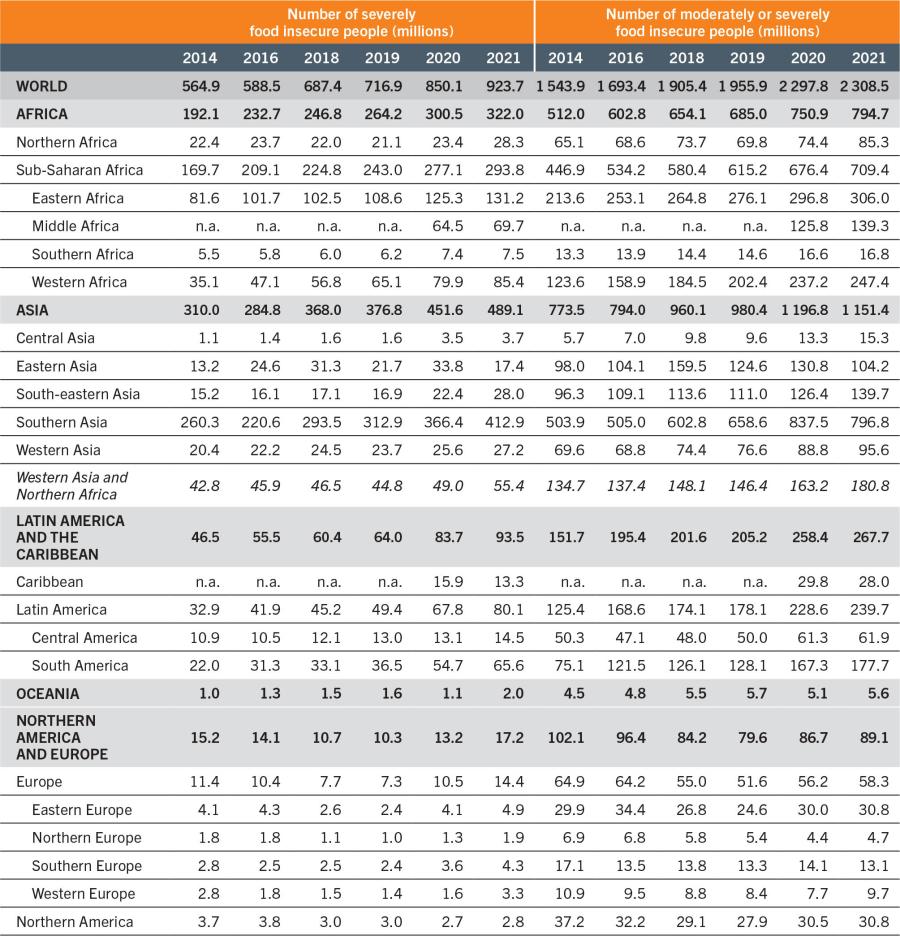
It is also important to note that the looking at the % of the population affected by food insecurity doesn’t necessarily highlight the full scale of the problem in terms of people affected. Looking at an adapted version of Table 4 from the report, we get a sense of the huge scale of this problem.
TABLE 4: NUMBER OF PEOPLE EXPERIENCING FOOD INSECURITY AT SEVERE LEVEL ONLY, AND AT MODERATE OR SEVERE LEVEL, BASED ON THE FOOD INSECURITY EXPERIENCE SCALE, 2014–2021
NOTES: n.a. = not available, as data are available only for a limited number of countries, representing less than 50 percent of the population in the region. The estimates for Latin America and the Caribbean from 2014 to 2019 include Caribbean countries whose combined populations represent only 30 percent of the population of that subregion, while the 2020 and 2021 estimates include Caribbean countries whose combined populations represent around 60 and 65 percent, respectively, of the subregional population. The countries included in the 2021 estimate for the Caribbean subregion are: Antigua and Barbuda, Bahamas, Barbados, Dominica, Dominican Republic, Grenada, Haiti, Jamaica, Saint Kitts and Nevis, Saint Lucia, Saint Vincent and the Grenadines, and Trinidad and Tobago.
Image source: FAO.
In 2021, 2.3 billion people globally were moderately or severely food insecure - figuring out how to support all of these individuals across different contexts and different resource constraints to become food secure is no mean feat! But not acting is not an option.
A starting point in this journey is to get an idea of the reasons underlying why food insecurity exists. Figure 16 from the report gives us some clues:
FIGURE 16: THE COST OF A HEATHY DIET INCREASED, AND THE DIET WAS MORE UNAFFORDABLE IN EVERY REGION OF THE WORLD IN 2020
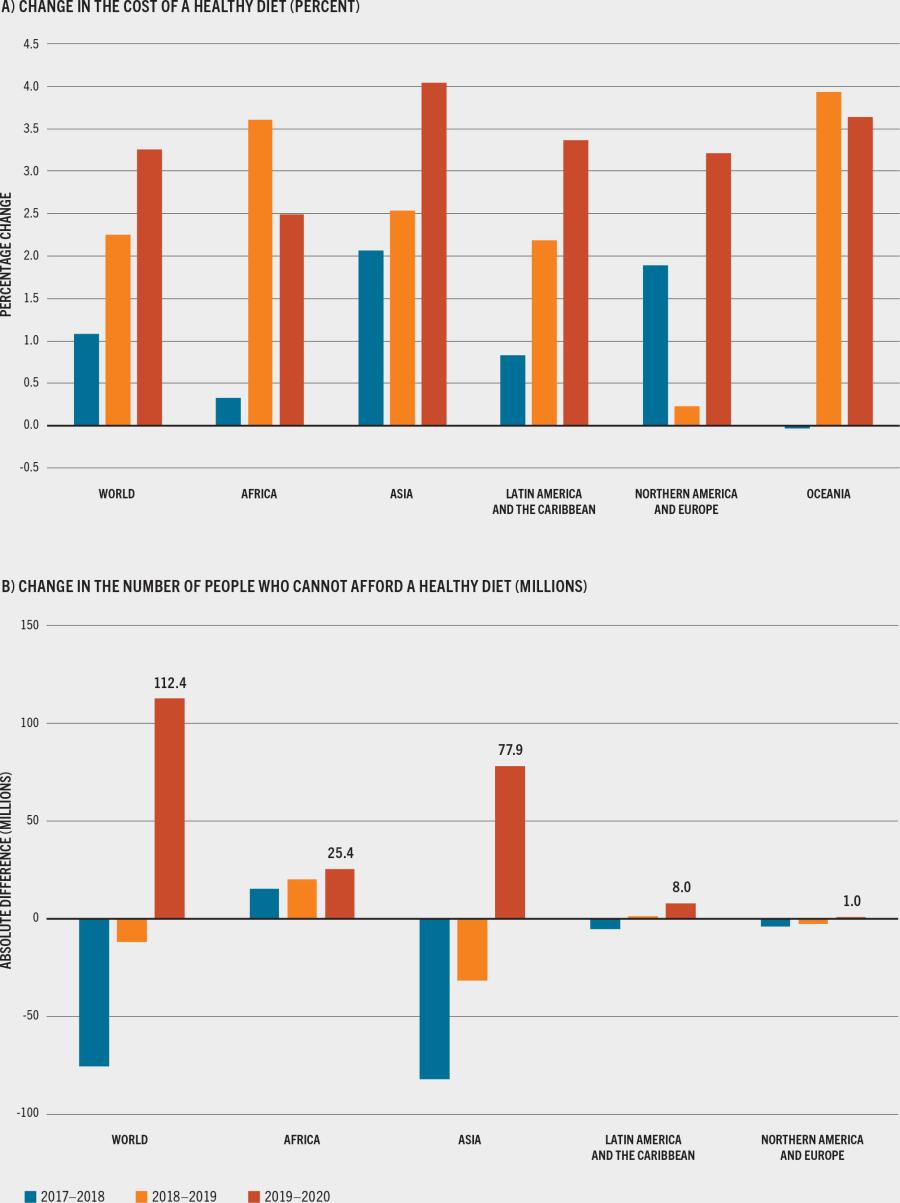
NOTE: In Oceania, the diet cost increase between 2018 and 2019 is heavily influenced by food price inflation in Australia.
Image source: FAO.
The increase in food prices and stagnant wages made food unaffordable for large proportions of the global population – in 2022 this has been made even worse because of the war in Ukraine and the inflation and cost of living crisis. The affordability and price of food is an important leverage point to address food insecurity and in the next post we will explore policy mechanisms that could be used to effectively address this.
Until next time!

